The goal of InSituASProfile is to provide an easy way to calculate the insitu sprint acceleration-speed profile based on gps data from the concept described by Morin et al. 2021 published in Journal of Biomechanics, DOI: 10.1016/j.jbiomech.2021.110524
For a walk through of the package, please click here
Installation
You can install the development version of InSituASProfile from GitHub with:
# install.packages("devtools")
devtools::install_github("LasseIshoi/ASProfile")
Example
This is a basic example of how to use the InSituASProfile Package:
If you have csv files from a single player located in a folder, you can use the InSituASProfile::import_data function, which basically list files from a folder, and combine into a single data frame. YOu need to specify the names of velocity and acceleration columns. If for example you have Catapult as a gps provider, this process can be streamlined easily using the API (click here for an example).
Prepare data
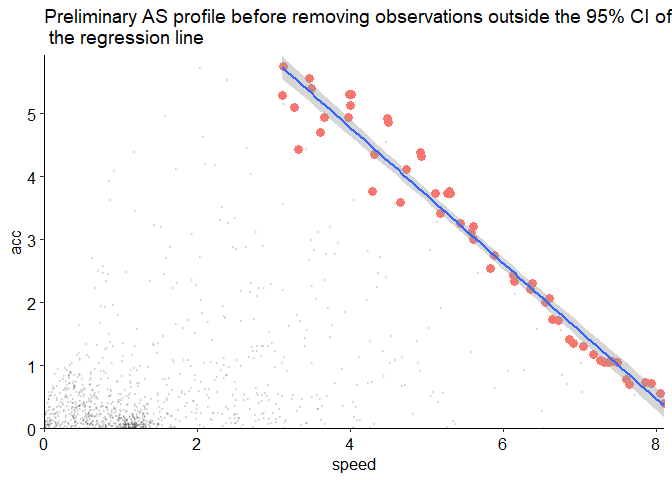
This step cleans the data frame by 1) omitting all acceleration values below 0, 2) identify the two highest acceleration values for every consecutive 0.1 m/s cut starting from 3 m/s, and 3) create an initial regression line and associated preliminary plot (if not FALSE)
InSituASProfile::prepare_data(data_import, print_plot = TRUE)
Calculate the AS Profile
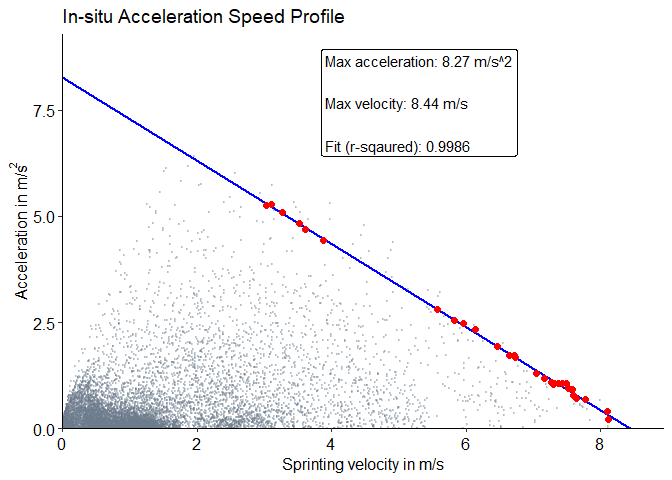
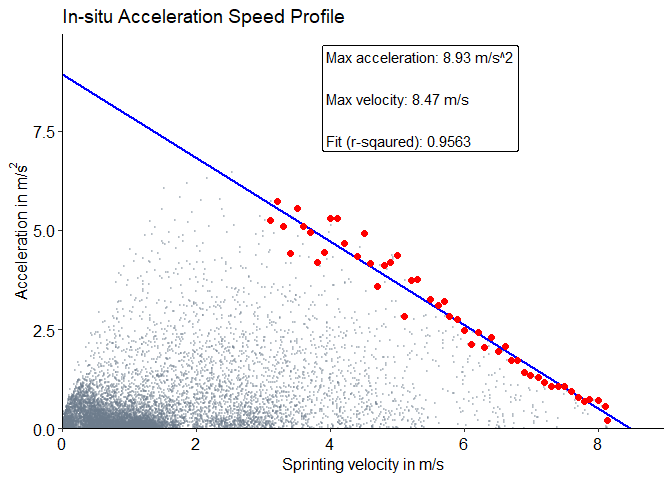
Calculate the A-S Profile. This step uses the data exported from prepare_data, and to calculate the A-S Profile. It plots the A-S Profile as default (TRUE), while a plot showing the regression line is not printed by default (FALSE). By default data is cleaned using the removal of points outside of the 95 % Confidence Intervals of the initial regression line (ci_outlier_detection = TRUE), or using the Turkey Boxplot method, which removes points outside of the IQR * 1.5 including the top 2 percent of points for each velocity bin.
CI Method
InSituASProfile::get_AS_Profile(print_plot_regression_line = FALSE,
                                print_AS_plot = TRUE,
                                ci_outlier_detection = TRUE)
Boxplot Method
InSituASProfile::get_AS_Profile(print_plot_regression_line = FALSE,
                                print_AS_plot = TRUE,
                                ci_outlier_detection = FALSE)
